Radial menus
Move the pointer over the waveform or FFT display and press A to open its radial menu. Press A again to close it. The waveform wheel gives quick access to analysis tools and drawing options; the FFT wheel combines display choices, analysis settings and FFT templates.
Keep the editor focused and the pointer over the display when opening a wheel. These shortcuts are unavailable while typing in a text field or using another modal dialog.
Waveform wheel
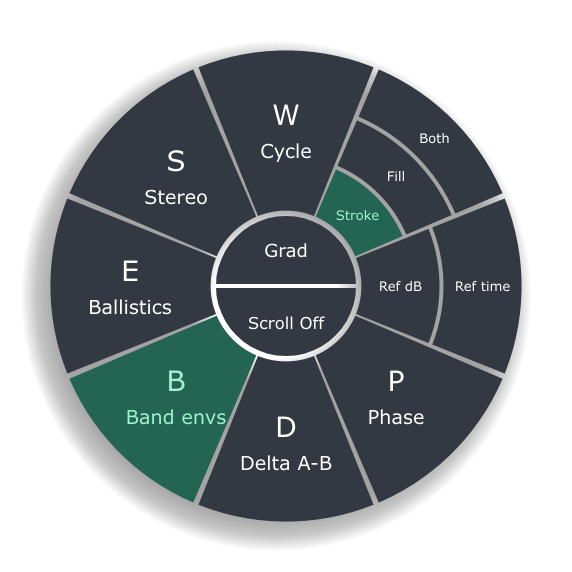
Click an analyser sector to toggle that tool. The wheel closes after selecting an analyser; drawing, reference and center controls stay open for further adjustments.
| Control | Action |
|---|---|
| Cycle, Phase | Toggle cycle tracking or phase correlation. |
| Band envs, Ballistics | Select band envelopes or ballistics. |
| Delta A-B | Toggle Delta comparison. |
| Stereo | Toggle the stereo analyser. |
| Stroke, Fill, Both | Draw the waveform outline, filled shape, or both. |
| Ref dB, Ref time | Show or hide the level and time reference lines. |
| Grad | Toggle the waveform gradient. |
| Scroll On / Scroll Off | Toggle waveform scrolling. |
Band envelopes, Delta A-B and Ballistics are mutually exclusive waveform modes. Selecting the active mode again returns to Waveform. See the Show menu for the drawing, gradient and reference-line settings, and Keyboard shortcuts for direct analyser keys.
FFT wheel
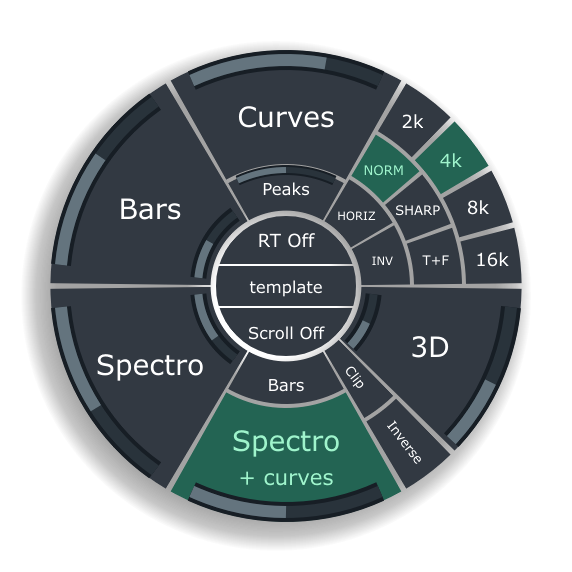
Click a main display sector to select Curves, Bars, 3D, Spectro + curves / + bars, or Spectro. The wheel closes after a display selection. Smaller buttons and arc adjustments keep it open.
| Control | Action |
|---|---|
| NORM, SHARP, T+F | Select normal analysis, Sharp, or time-and-frequency reassignment. SHARP uses the currently selected Sharp algorithm; see Advanced spectrogram views. |
| 2k, 4k, 8k, 16k | Choose an FFT size. The full FFT menu provides the other available sizes. |
| HORIZ / VERT | Switch the spectrogram orientation while retaining its inversion setting. |
| INV | Invert the spectrogram direction while retaining its orientation. |
| Peaks | Show or hide the peak curve. |
| Small Bars button | Switch between curves and bars in the spectrogram overlay. It also selects the overlay view if needed. |
| Clip | Clip the spectrogram to the FFT curves. Enabling it selects a 2D overlay in the current orientation. |
| Inverse | With Clip enabled, show the image outside the curves. |
| RT On / RT Off | Toggle RT mode for a visible 2D spectrogram. |
| Scroll On / Scroll Off | Toggle scrolling for a visible 2D spectrogram. |
| template | Open the templates wheel. |
RT and Scroll are dimmed and inactive when the 2D spectrogram is not visible, including in 3D view. Orientation controls are in the settings sector, separate from the center buttons.
Adjust the arcs
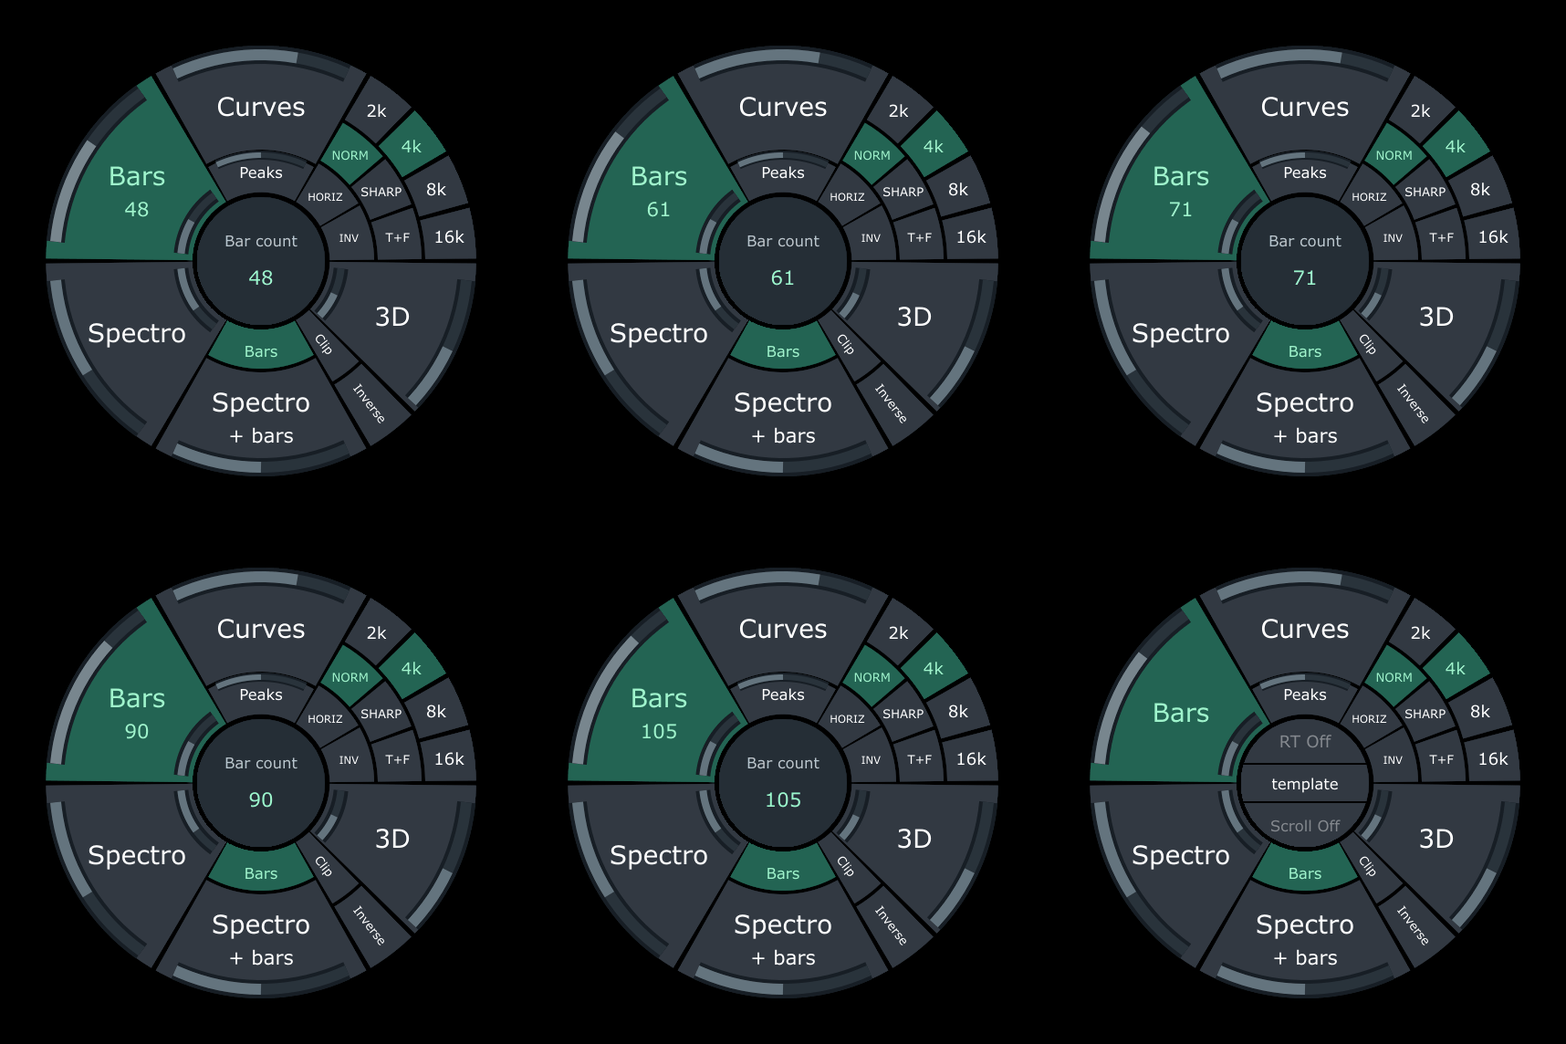
Hover an arc to see its setting and value in the center. Hold the left mouse button on the arc and drag vertically: upward increases the value, downward decreases it. Right-click the arc to reset it.
| Area | Arc adjustments |
|---|---|
| Curves | Averaging and Peak decay. Enable Peaks to see the peak curve. |
| Bars | Bar count and Brightness. Changing Bar count exits semitone mode; adjusting Brightness enables individual bar coloring. |
| Spectro with curves or bars | Image opacity. |
| Spectro | Bias and Gain for the image. |
| 3D | Height and angle. |
For example, select Bars, reopen the wheel, then drag the Bar count arc to change the number of frequency bands. Right-click that arc to reset the count. The FFT settings menu contains the full set of controls and their descriptions.