CURVE EDITOR / WORKSPACE
Editing curves
Use Curve Editor to shape the selected sound over time or edit a waveform. Open Dual when you also need the sound parameters. Always check the Sound selector and the curve selector before editing: the same gesture can reshape a pitch envelope, an amplitude envelope or an oscillator waveform.
Read the workspace
The graph contains main points, which divide the curve into segments, and control points, which shape those segments. A segment's type determines how its control points affect the result. The axes and point information depend on the selected curve; a vertical position is not a universal gain or frequency value.
The upper strip contains duration controls and editing tools. The curve selector runs along the bottom of the editor. Use show to reveal horizontal zoom, vertical zoom and the segment strip. Disable extended to make room for these controls. The << button shows the shape palette at the left.


Edit points and handles
For ordinary point editing, leave draw / pen mode off.
| Action | Gesture in the graph |
|---|---|
| Move a point or handle | Left-drag it. Hold Ctrl for finer movement. |
| Insert a point at a chosen position | Double-click the graph. |
| Split an existing segment | Right-click an empty area of the graph. The new main point is placed on the curve at that horizontal position. |
| Remove a main point | Right-click the main point. |
| Reset a point's tangents | Middle-click the point while no region selection is active. |
Use link to choose whether tangent editing links the handles. The available handles and their limits depend on the segment type. Splitting is useful for adding detail, but check the resulting shape: not every segment type retains its exact shape after a split.
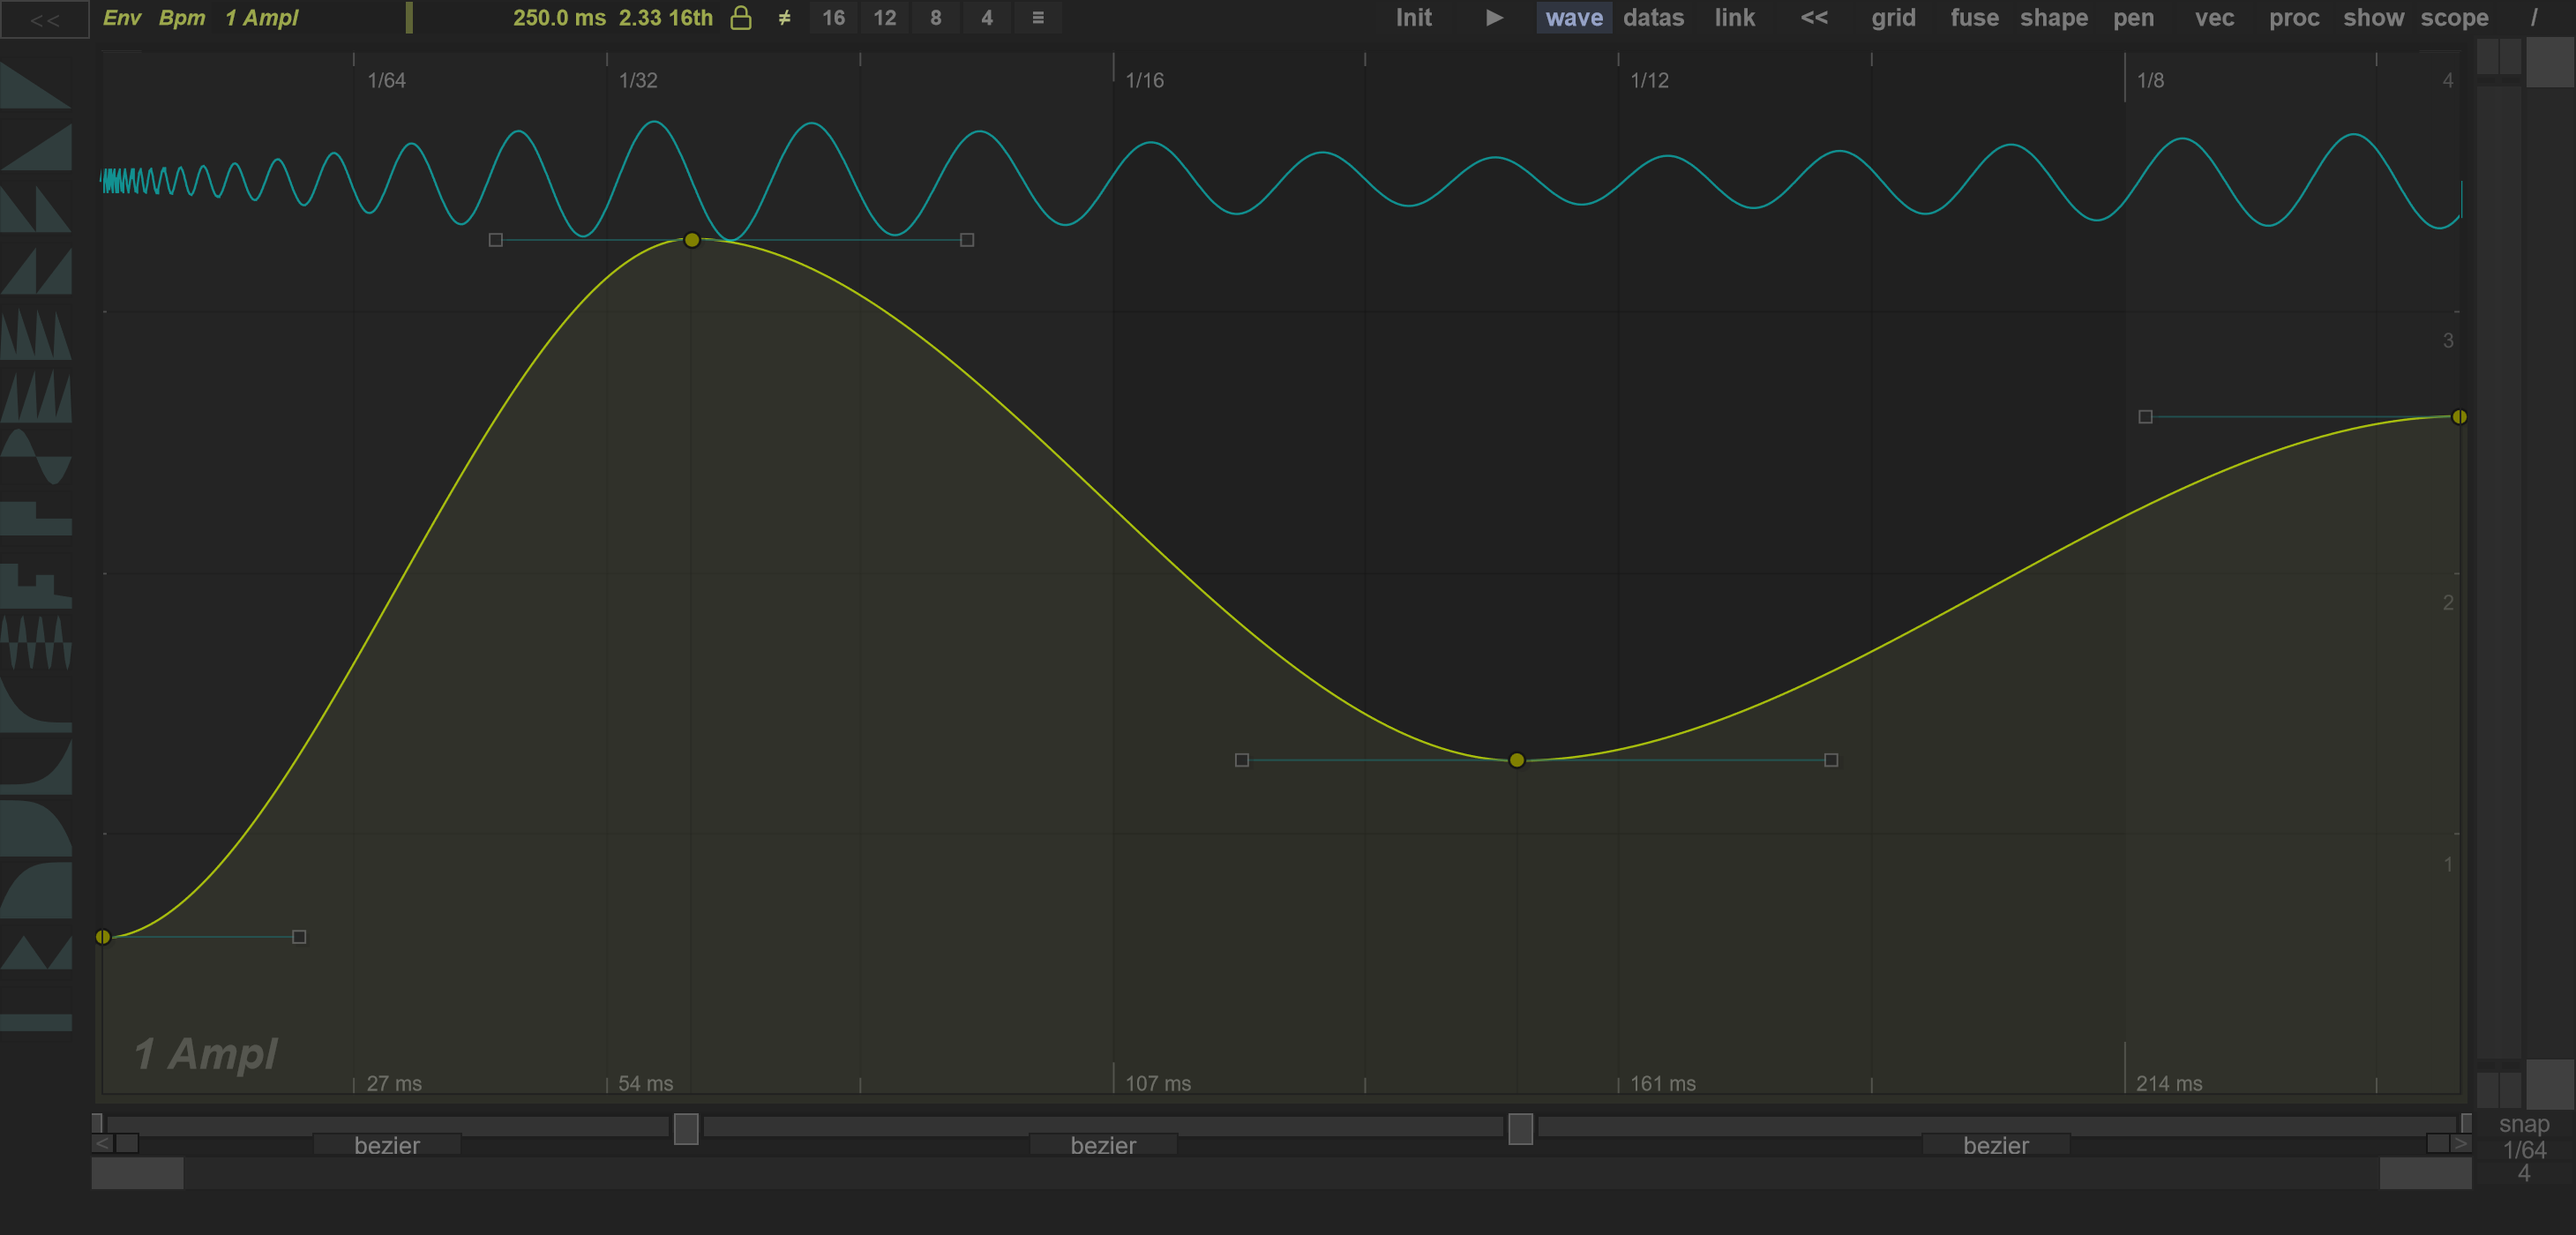
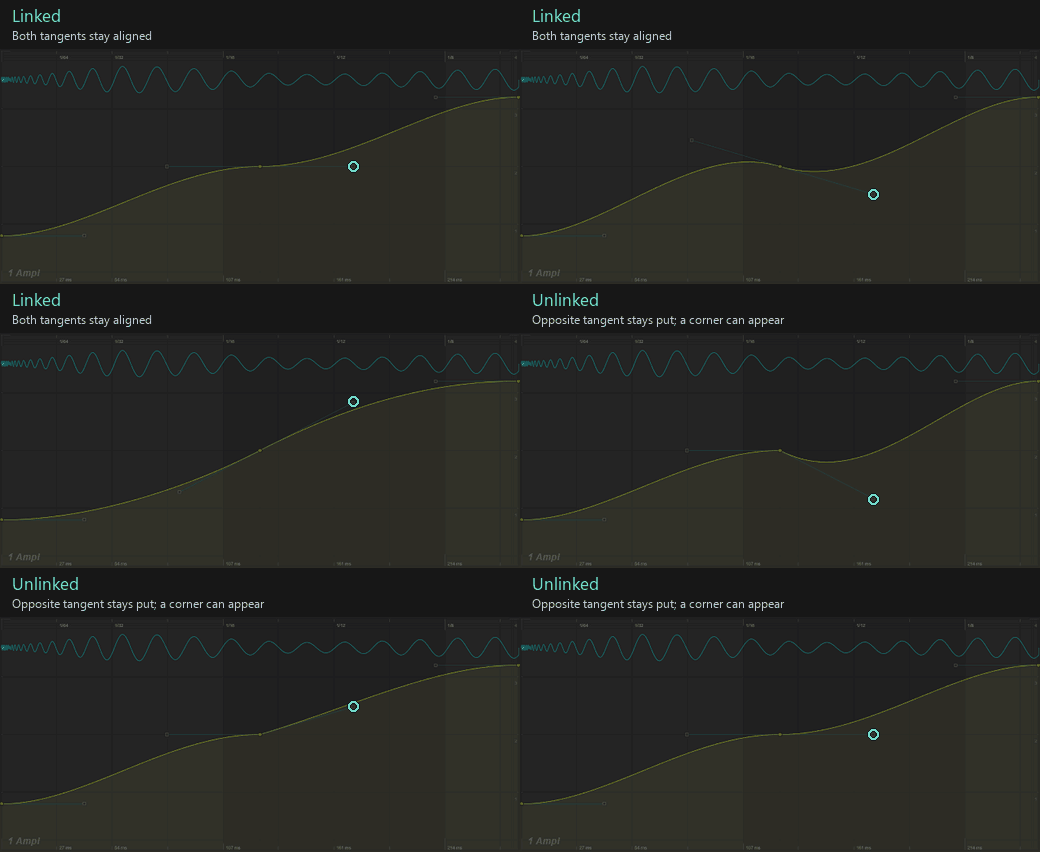
With link enabled, the opposite handle follows the angle to preserve a smooth tangent direction at the join. With link disabled, it stays independent, so the join can develop a corner. The segments still meet at the same main point.
Select and transform a region
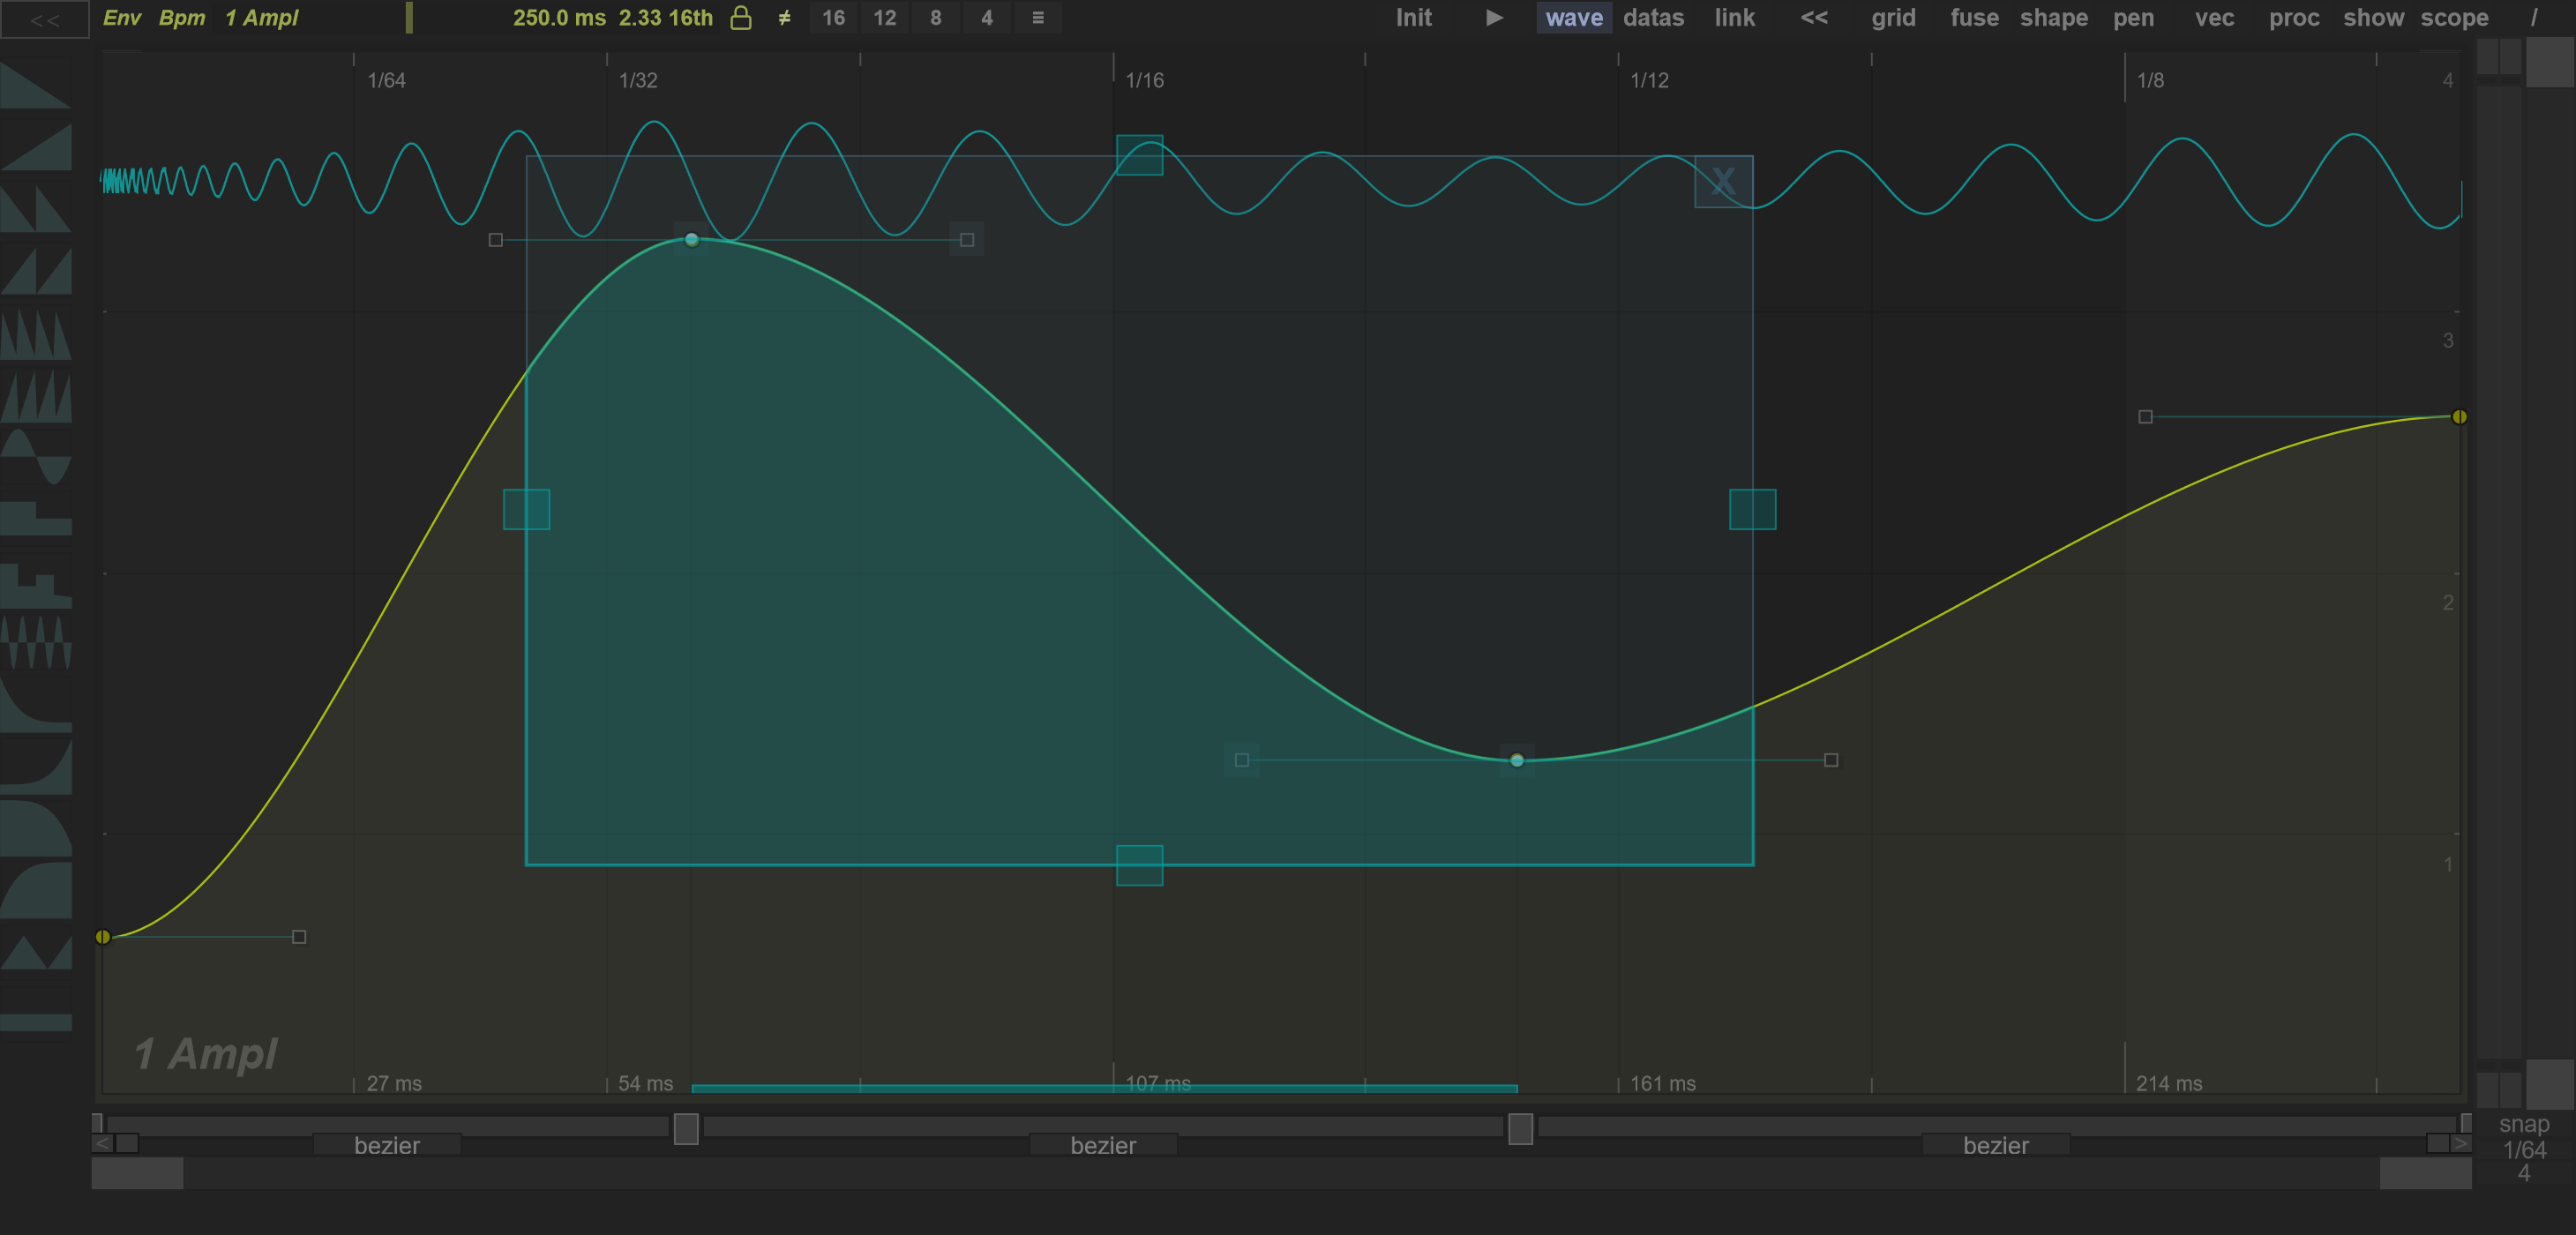
Left-drag an empty area to draw a selection rectangle around points. Once the selection is established, drag inside it to move the selected region, or drag its boundary handles to scale it. Ctrl gives finer movement; Shift constrains a region move to its dominant axis. Click outside the selection or use its close control to leave the selection.
With a selection active, Delete removes selected points and right-clicking the graph duplicates the selection. Clear the selection before using right-click to split a segment or remove one point.
| Shortcut | Curve editing action |
|---|---|
| Ctrl+A | Select the curve's points. |
| Ctrl+D | Duplicate selected points. |
| Ctrl+Shift+D | Insert a duplicate of the selected region. |
| Delete | Delete selected points. |
| Ctrl+C / Ctrl+V | Copy / paste the whole curve in the curve editing context. These do not copy only the selected points. |
| Ctrl+Z | Undo. Redo is also available in the context toolbar. |
Use these shortcuts with the editor focused, outside text entry. Curve copy/paste also applies in Dual.
Zoom and pan

Use the mouse wheel over the graph to zoom horizontally around the pointer. Hold Ctrl for finer zoom. Middle-drag to pan. The horizontal and vertical zoom controls provide another way to inspect a small region without changing curve data.
Shift-drag has a different meaning outside an active region selection: it invokes a zoom gesture. Use an ordinary drag for moving a single point.
Choose a segment in the strip

Enable show → segments. The strip below the graph represents the intervals between main points. Double-click a segment bar to select its region; Shift extends that selection across adjacent segments. Double-click a point square in the strip to enter point values numerically.
To change a segment's type, press its type label, move to the desired type in the chooser and release. The chooser's all option applies the type across the curve. The complete list is explained in Segment types.
Move points with the Segment Manager
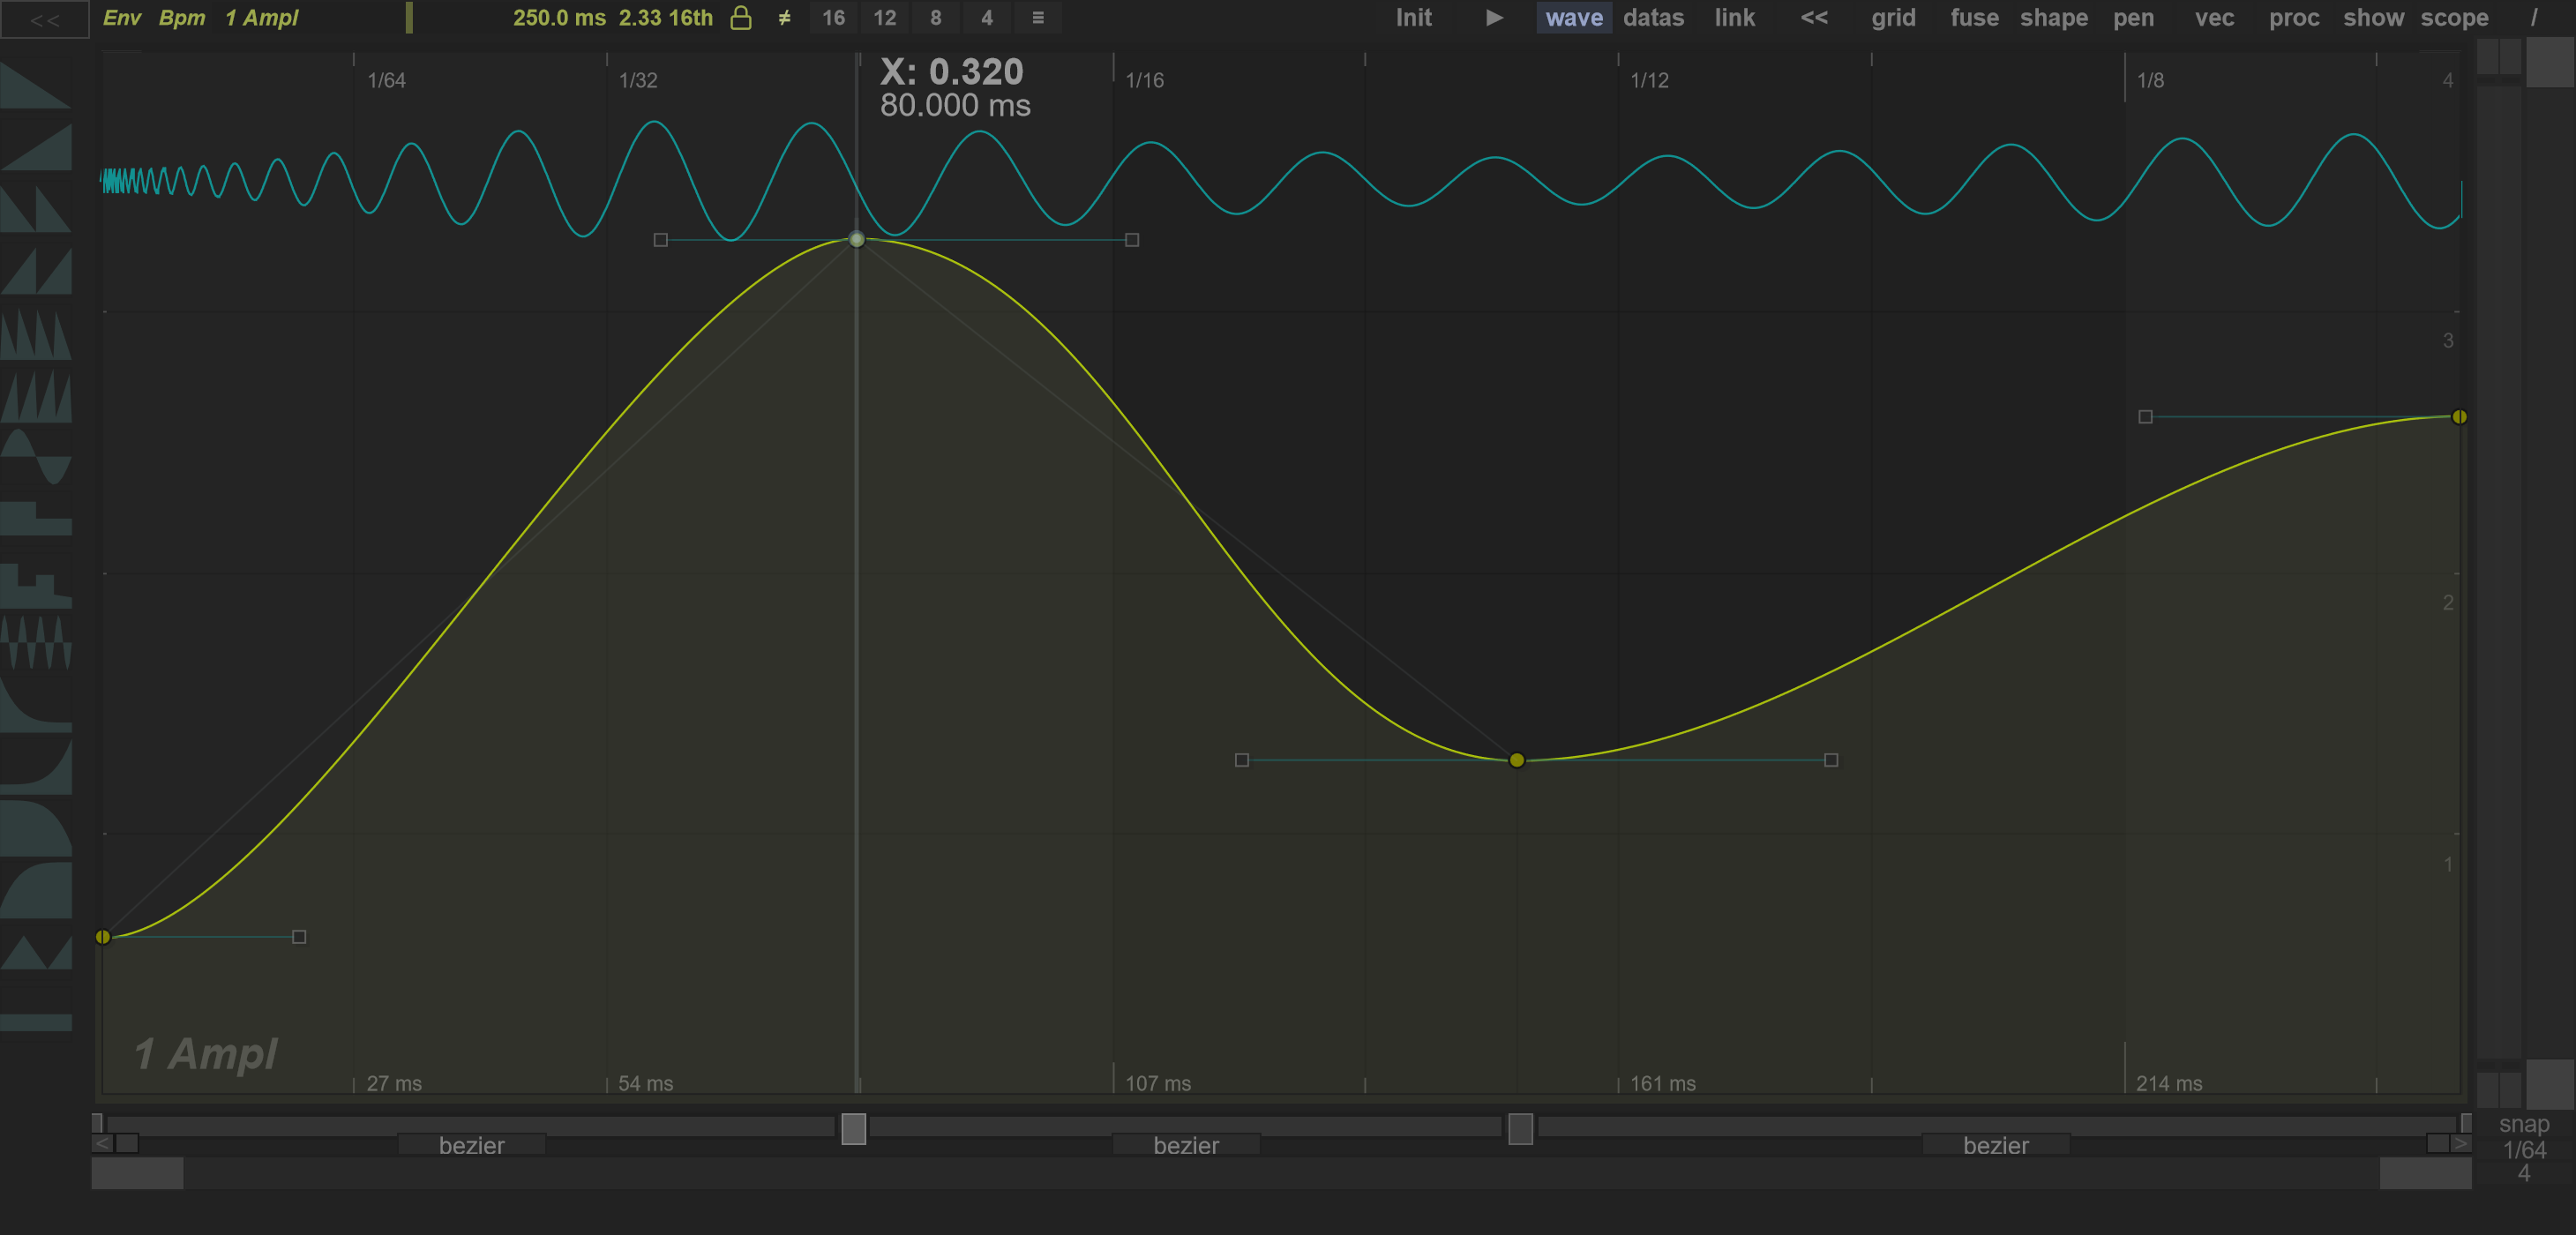
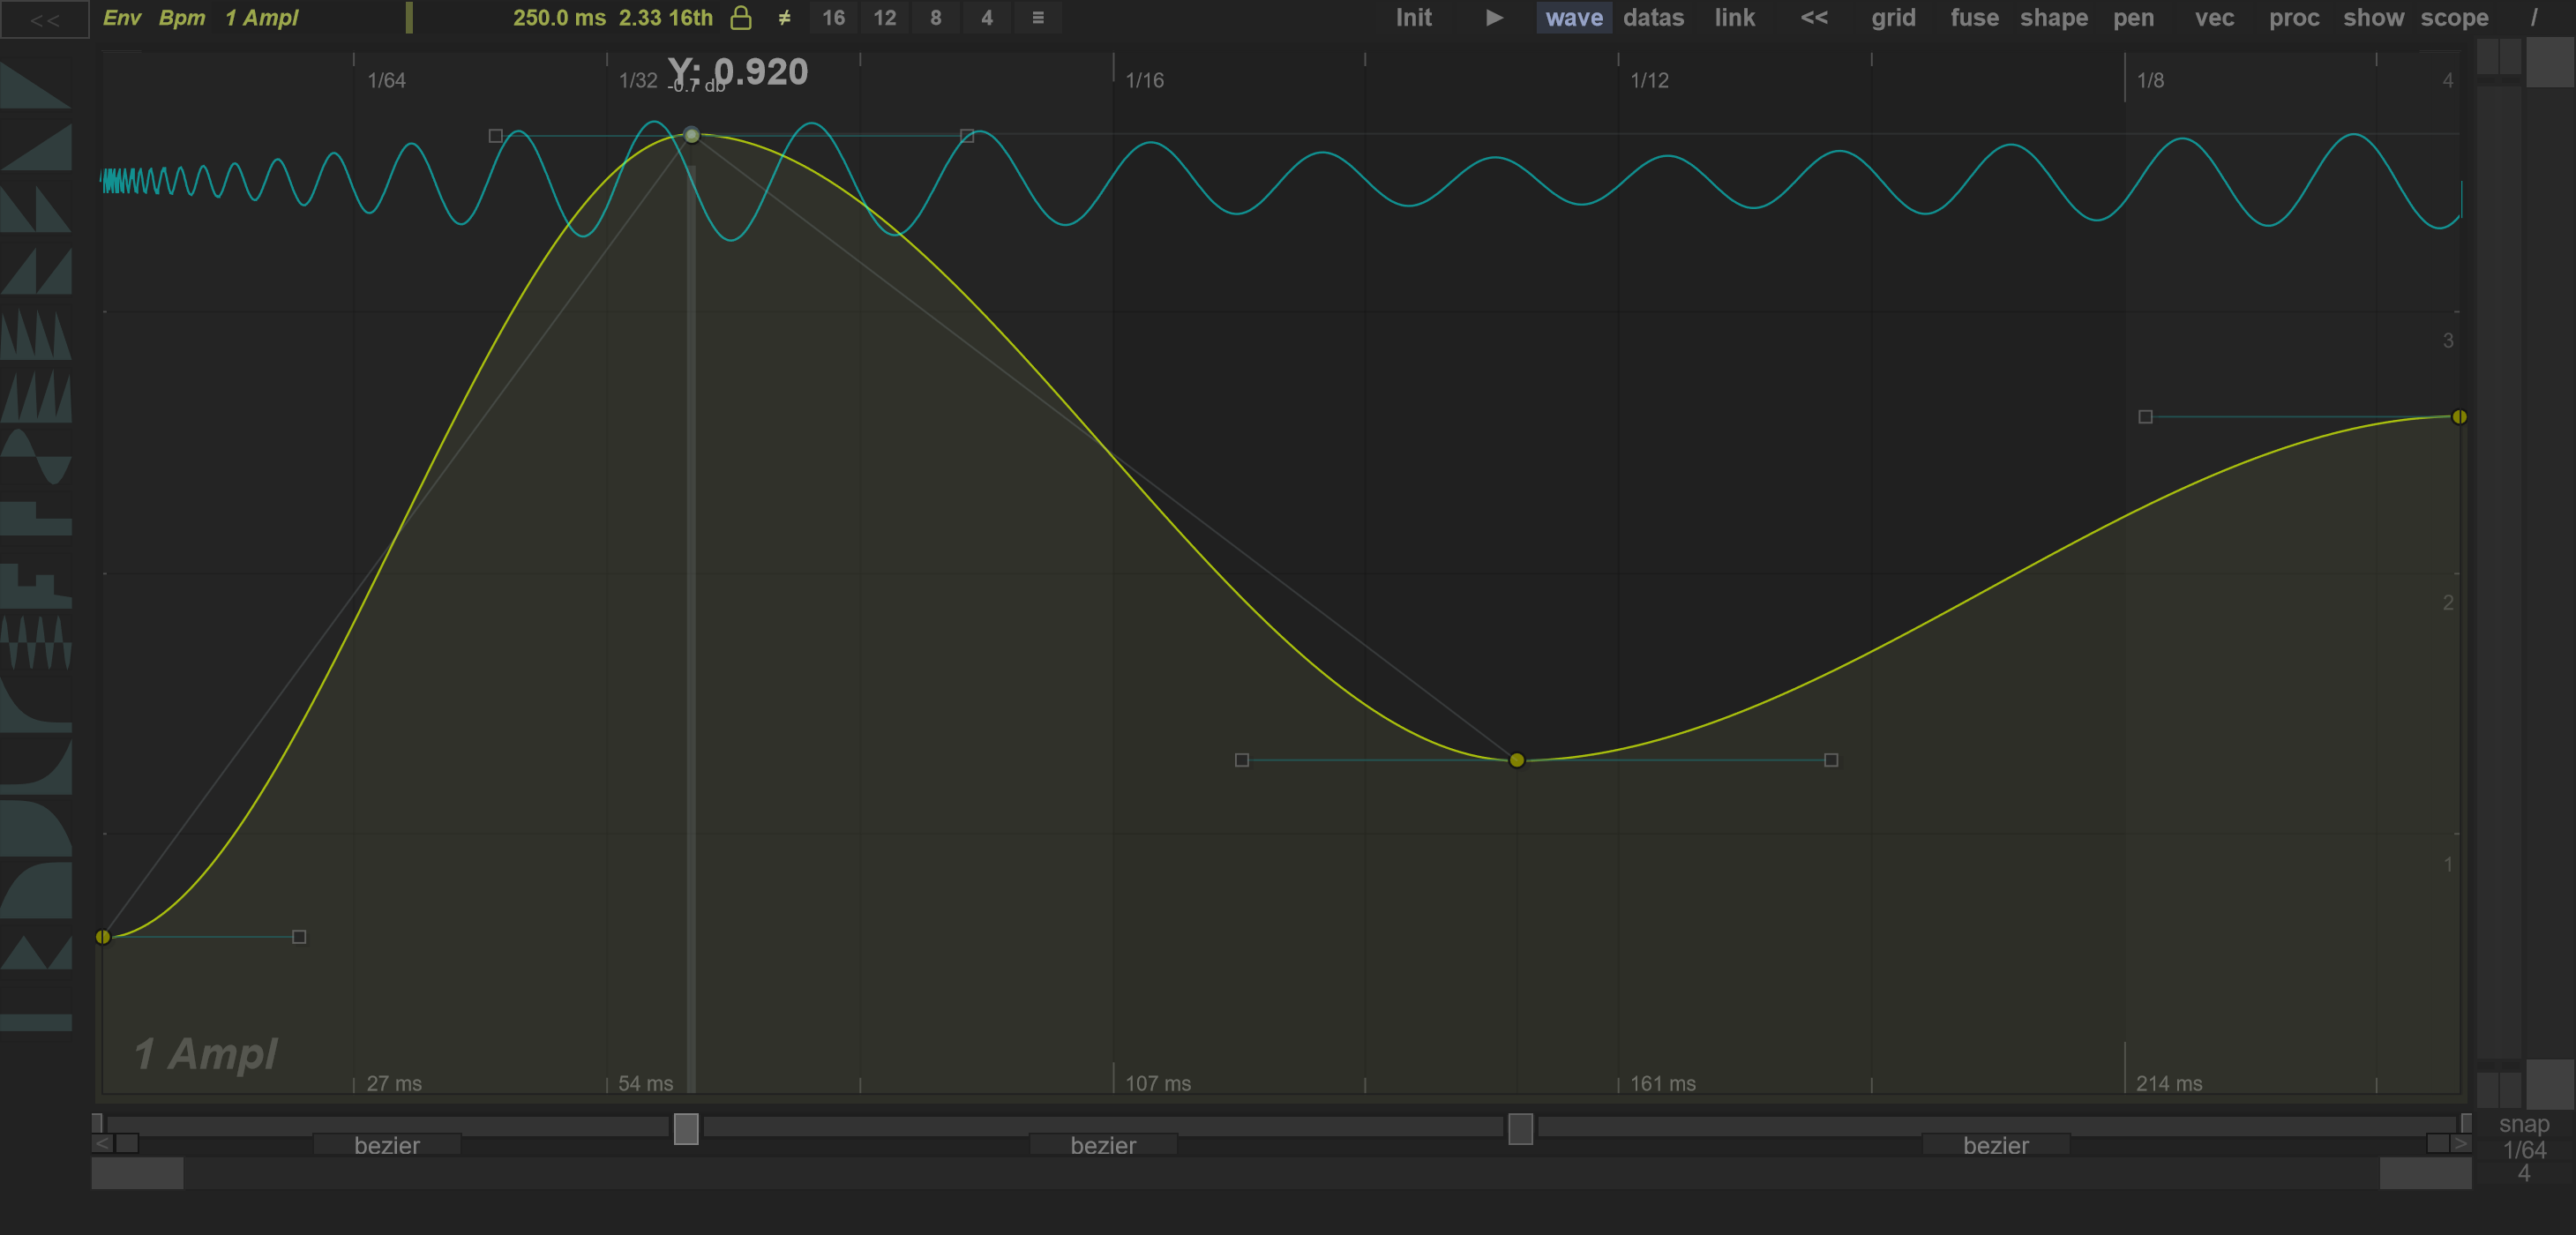
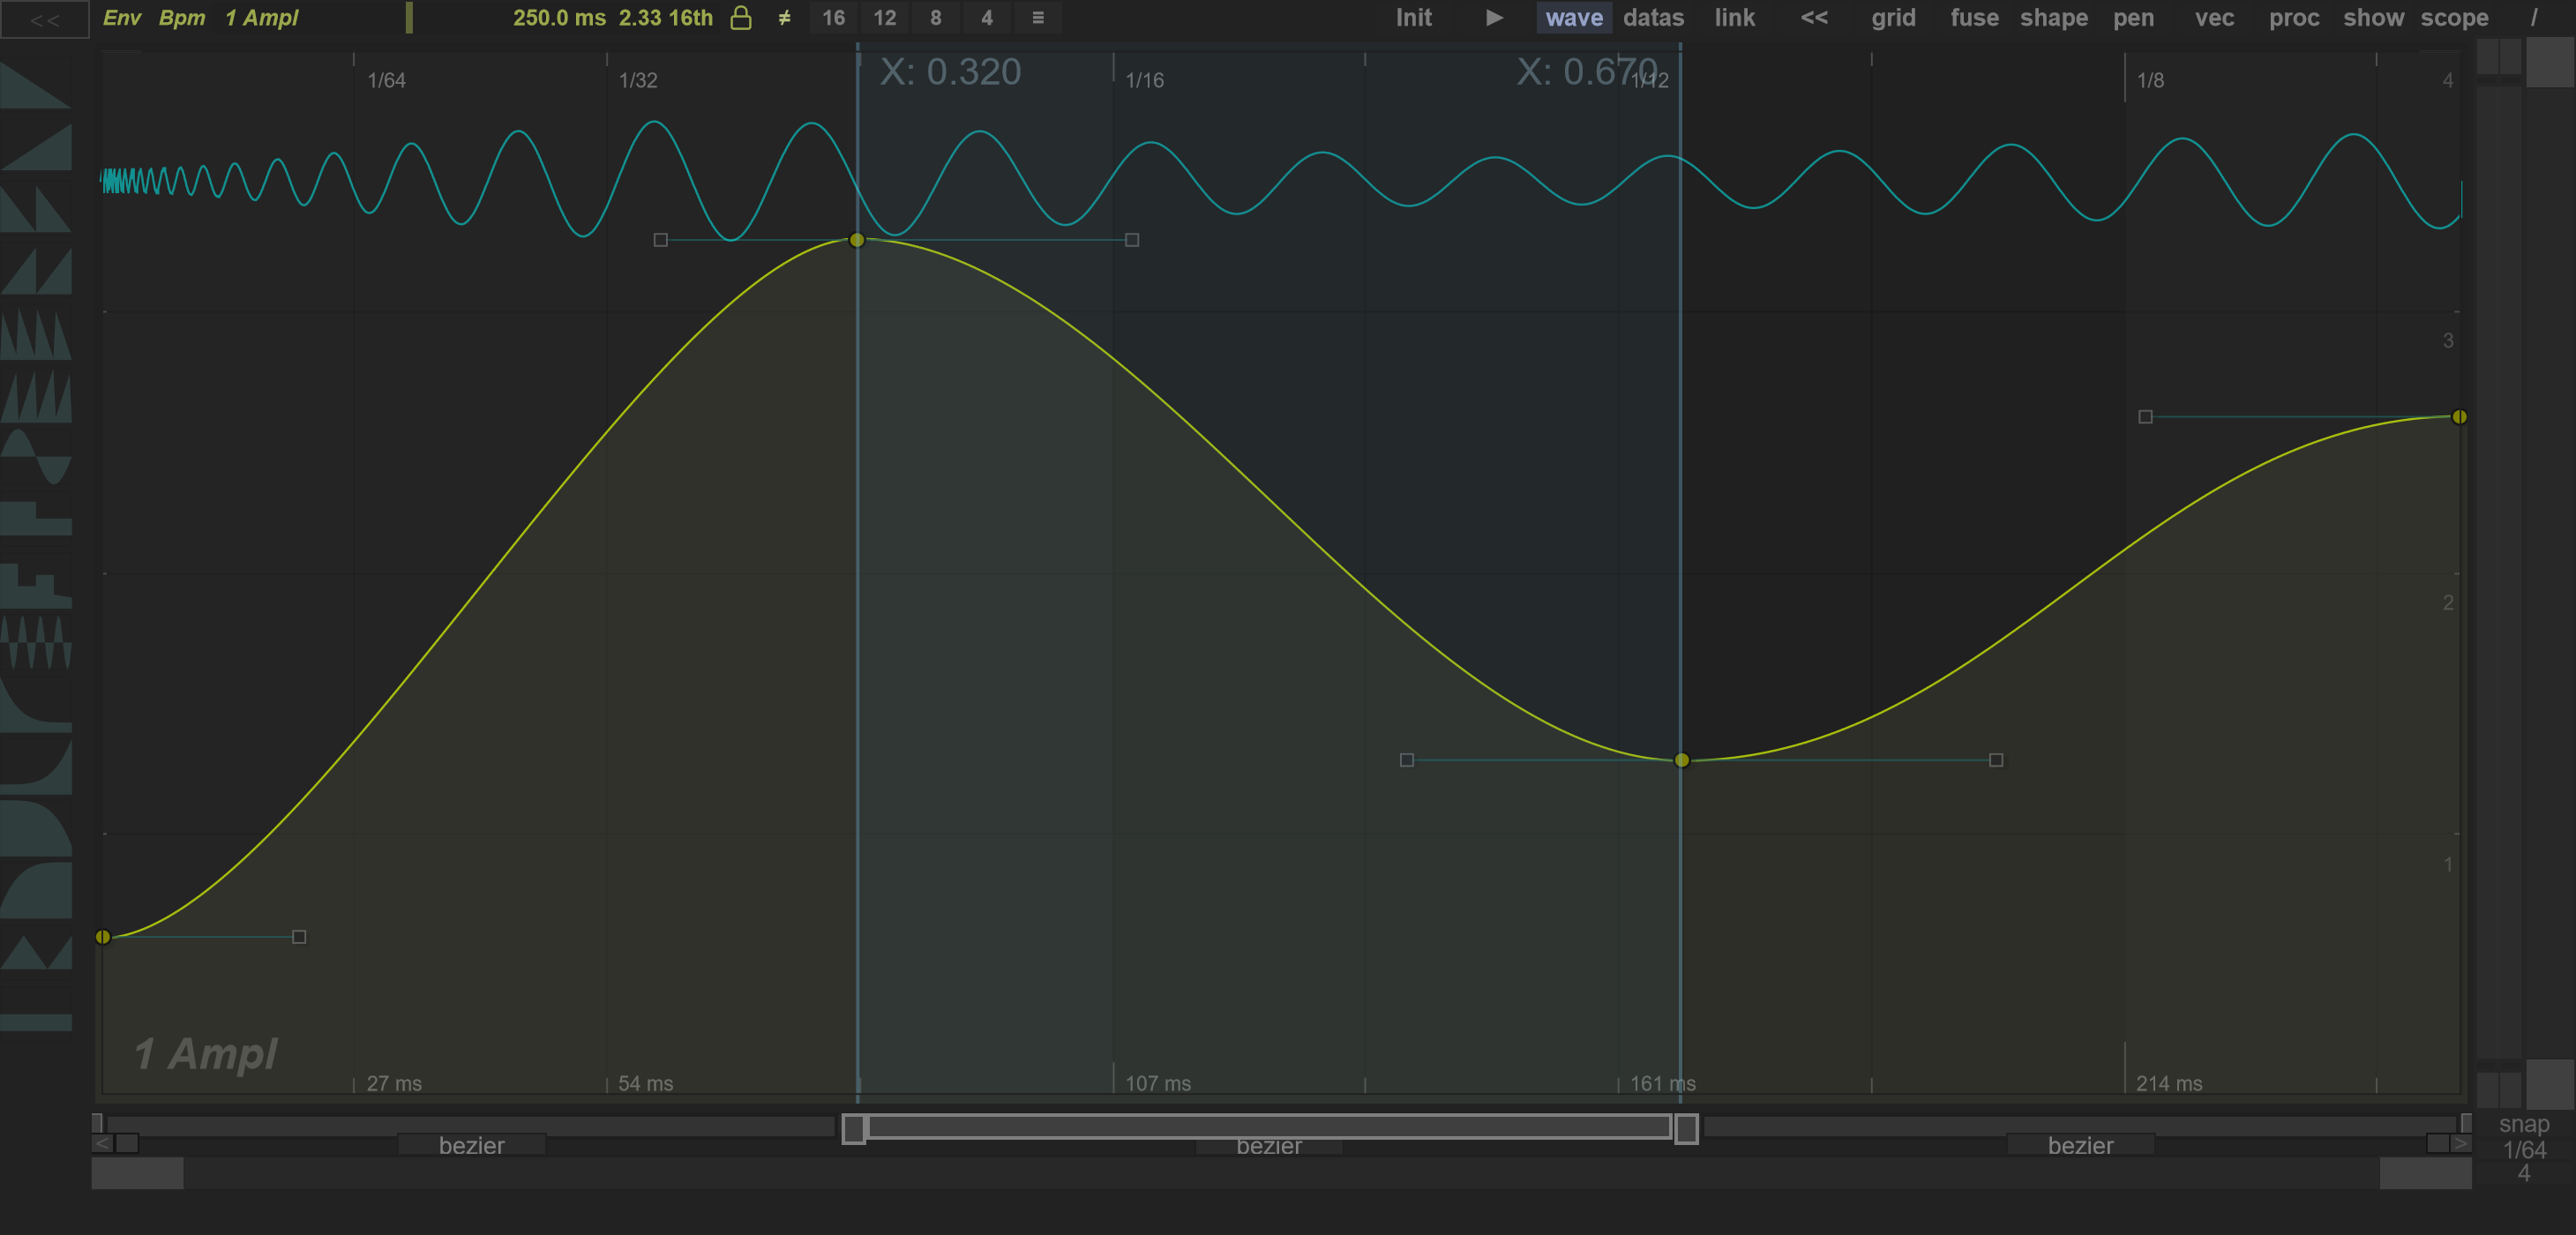
The Segment Manager also lets you edit the curve without grabbing points in the graph. Enable show → segments and leave draw / pen mode off. The squares mark main points; the bars between them represent segments. Drag the bar body rather than its type label, which opens the type chooser.
| Drag target | Horizontal drag (X) | Vertical drag (Y) |
|---|---|---|
| A point square | Move that main point along the time axis. | Change that main point's value. |
| A segment bar | Move both endpoints along the time axis together. | Raise or lower both endpoints together. |
The dominant drag direction chooses the axis, so use a clearly horizontal or vertical gesture. Hold Ctrl for finer movement. Movement is limited by the curve bounds and neighbouring points; with Snap enabled, the grid also affects the result. The graph highlights the affected point or segment while you drag. X represents position within the curve; Y follows the selected curve's value range.
Squares: one point
Bars: both endpoints
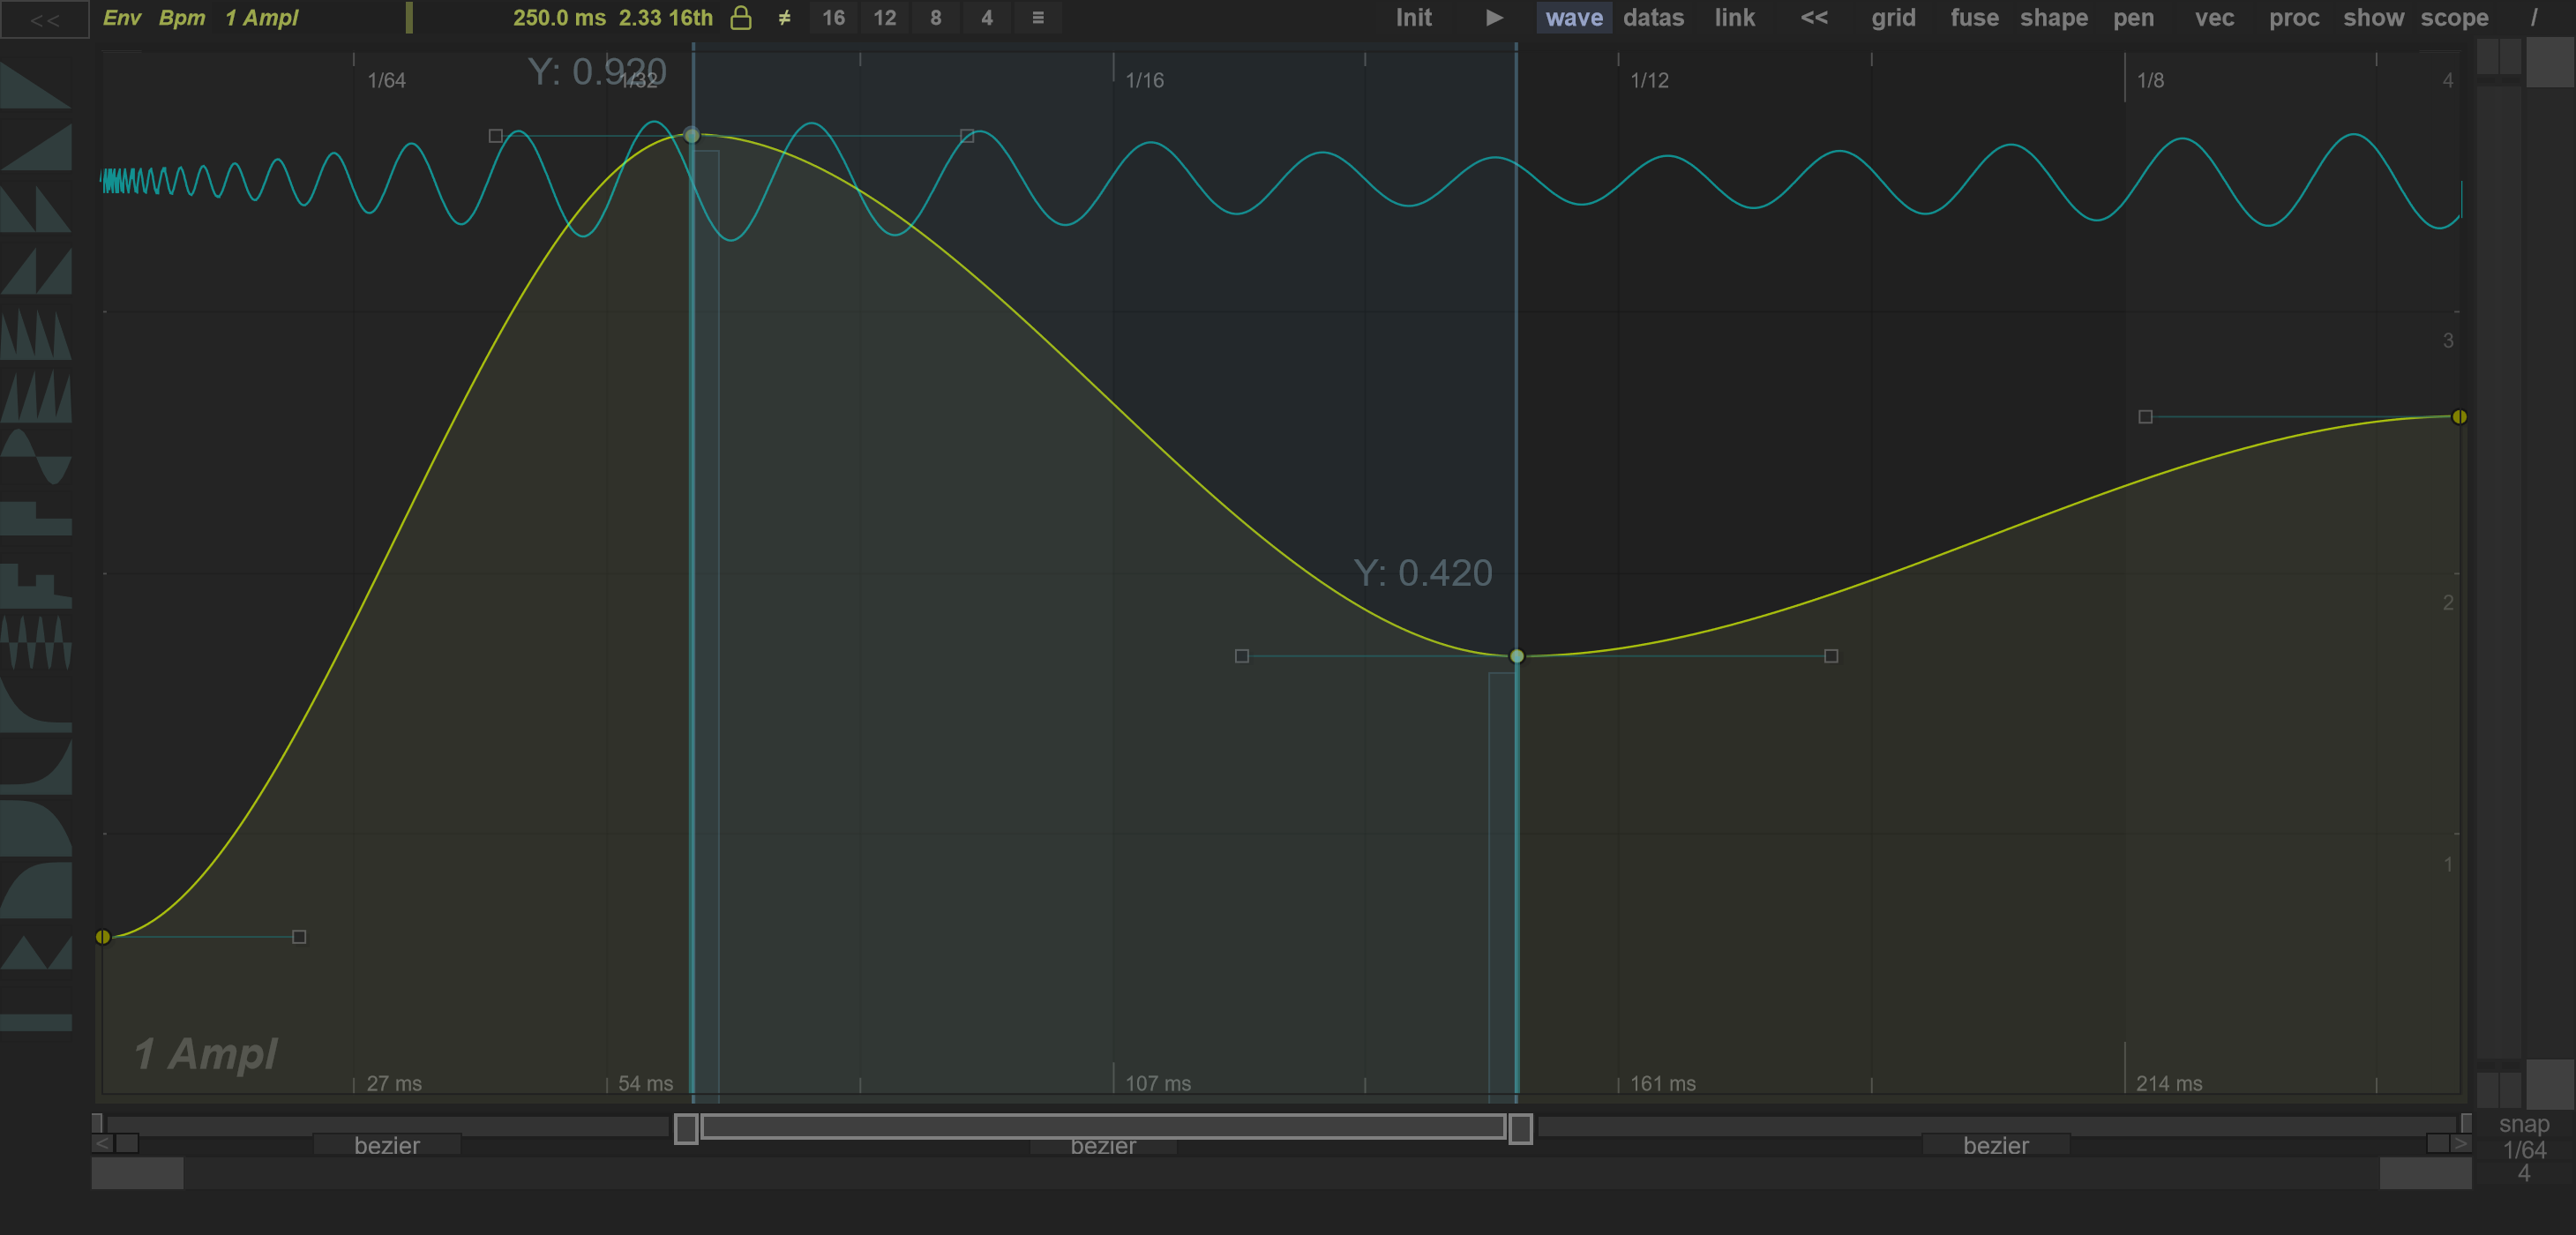

Right-click a square in the Segment Manager to delete its main point, or right-click a bar to delete its segment.
Double-click a segment bar to select its region in the graph. Hold Shift and double-click additional segment bars to extend the selected region.
Scale the curve vertically
The vertical scaler is the narrow range control at the right edge of the Curve Editor. It changes the curve's Y values, so it is useful for changing a contour's depth while keeping its timing.
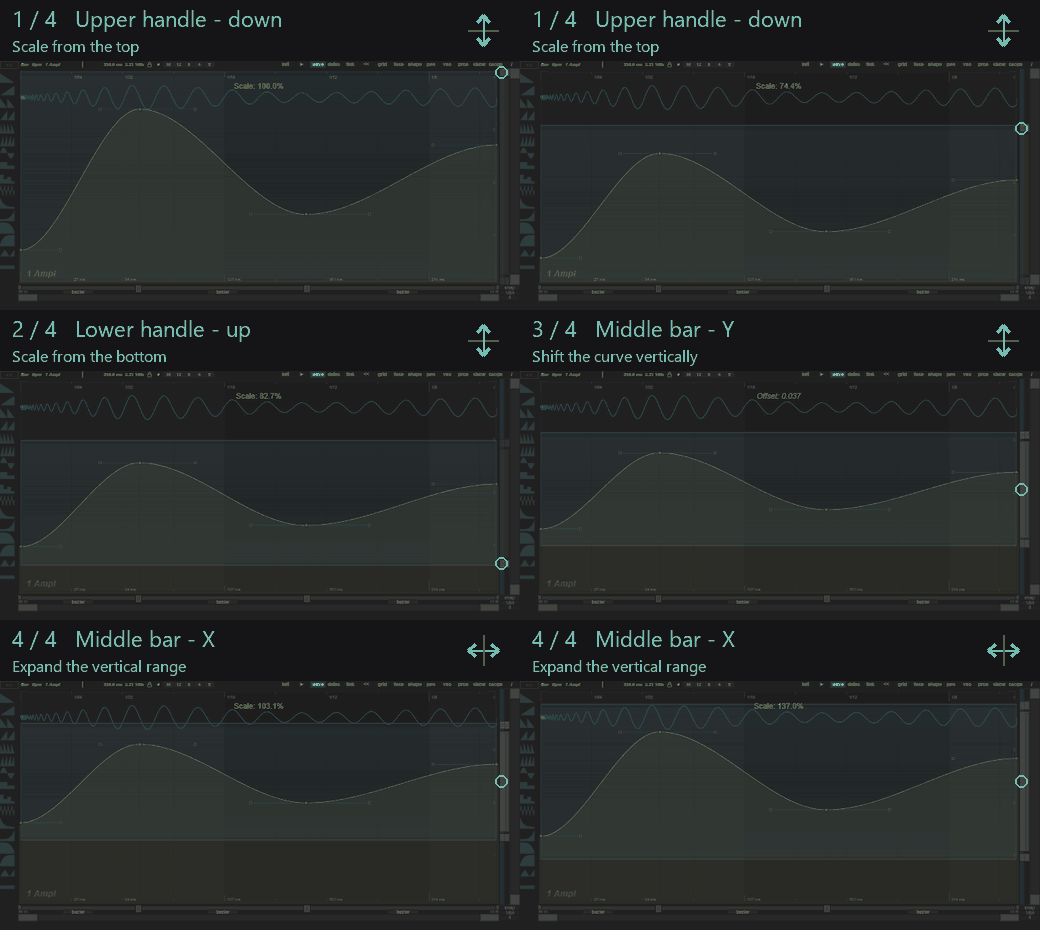
Use the left half of the control to edit the curve. Drag its upper or lower handle vertically to scale the curve into a smaller or larger Y range. Drag the middle bar vertically to shift that range; drag it horizontally to expand or compress the range around its centre. The right half lets you position the range handles first without changing curve data. If a region is selected, only its selected points are affected.
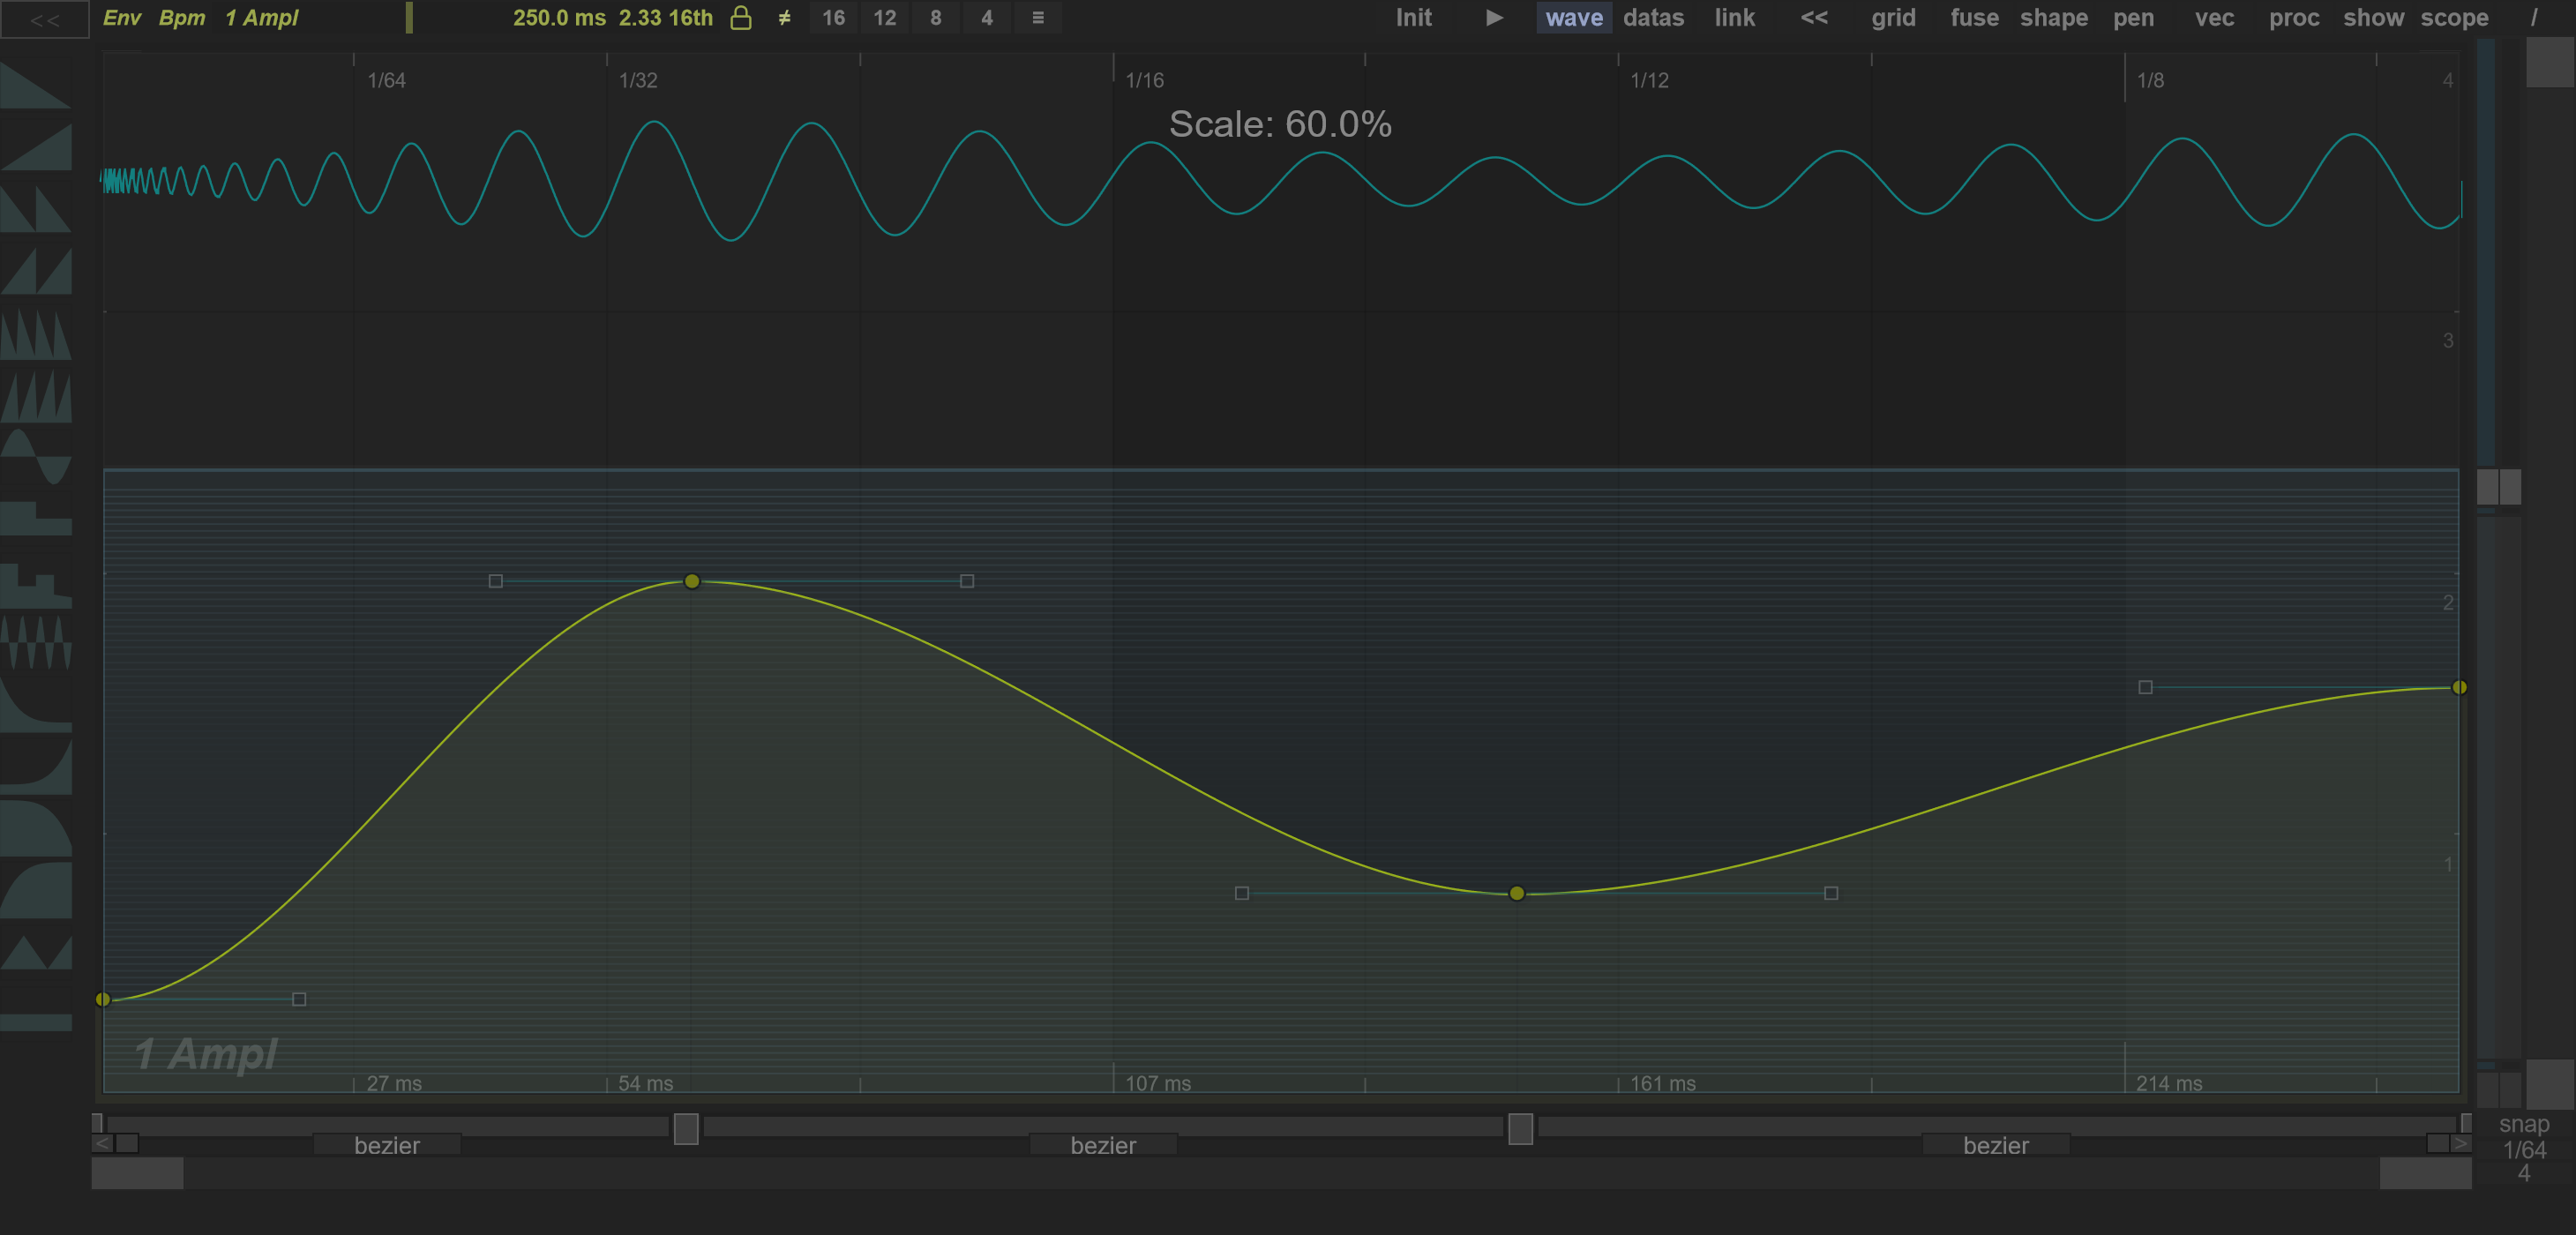
Example: Start with an amplitude curve and clear any region selection. In the left half of the scaler, drag the upper handle down while leaving the lower handle at the bottom. The curve becomes shallower across the same time span. The example below compresses the Y range to 60%; the native overlay displays the scale while editing. Use Undo to compare with the original. On other curves, the audible result follows that curve's destination and value range.
Before
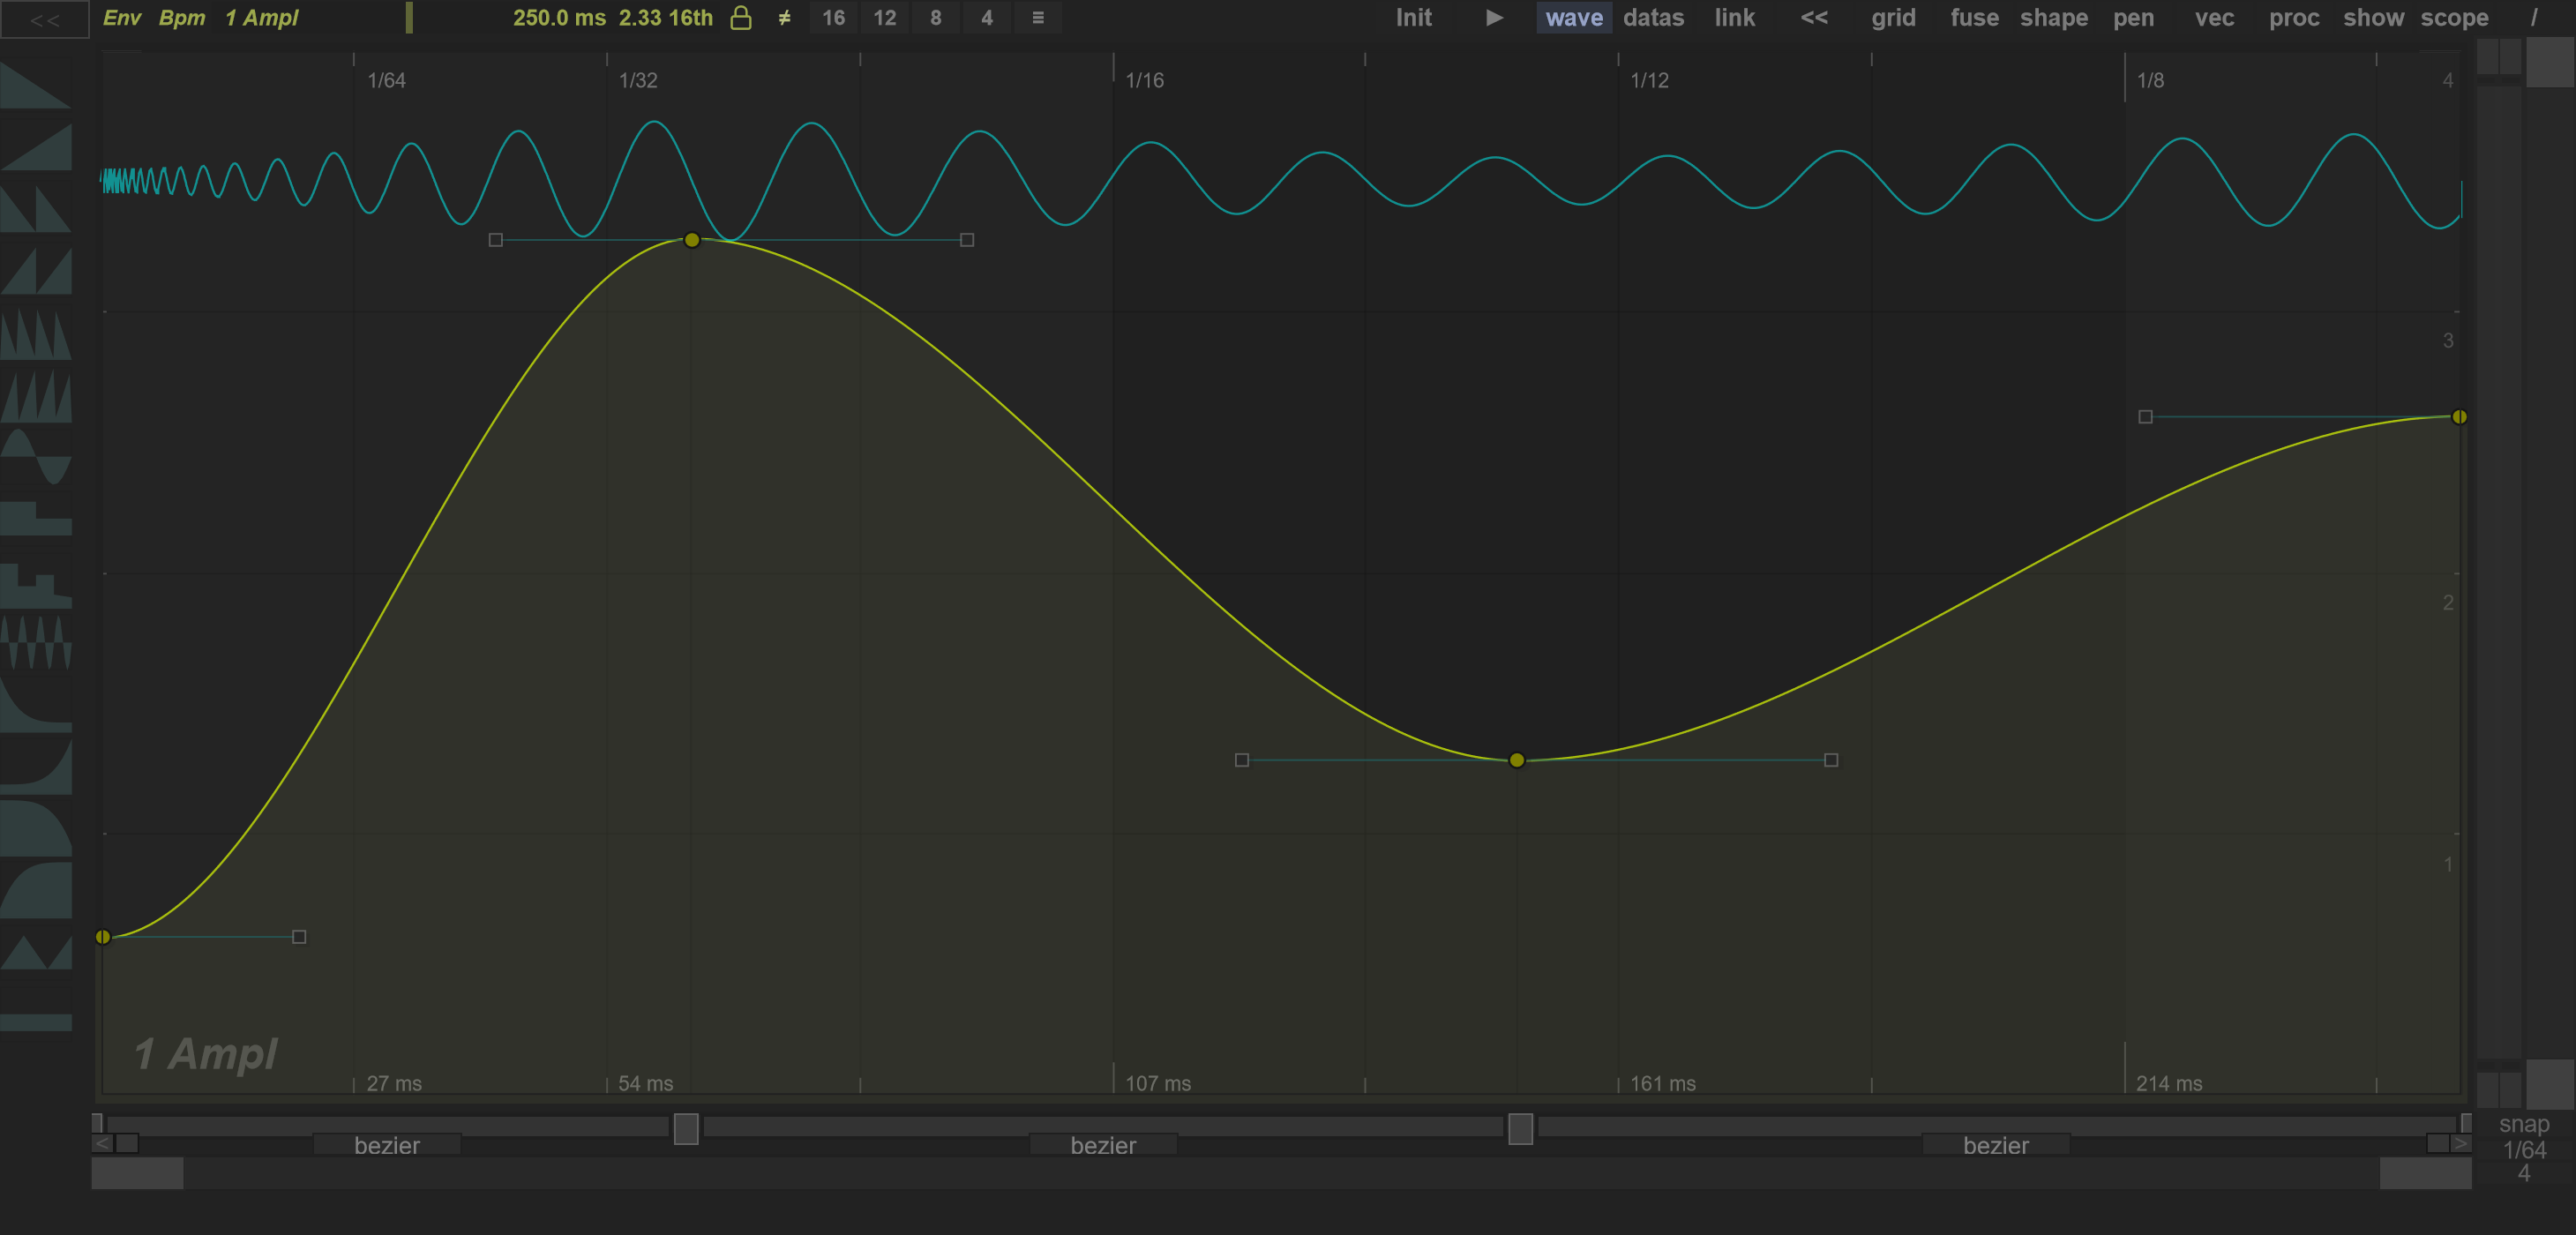
Scaled on Y
Continue with Tools and timing for snapping, drawing, shape generation and duration controls.